
BIChart Logo
BIChart

Tableau to Power BI Migration Assessment Tool — Plan Your Migration Approach

Free migration assessment tool for Tableau Server and Tableau Cloud: inventory dashboards, score complexity, and build a recommended migration plan.

Ready to convert dashboards? See the Tableau to Power BI migration tool for automated workbook conversion after your assessment, or explore the Tableau to Microsoft Fabric migration strategy.

Estimate migration cost with our Tableau to Power BI cost calculator.

Overview tab surfaces high-risk areas instantly
Workbook tab supports bulk migration actions
Data-source views expose dependency impact
PDF + Excel outputs ready for stakeholders

Get a Free Migration Assessment

Compatibility scoring, effort estimates, and migration-wave recommendations in one workflow.

We never store your data beyond the assessment process.

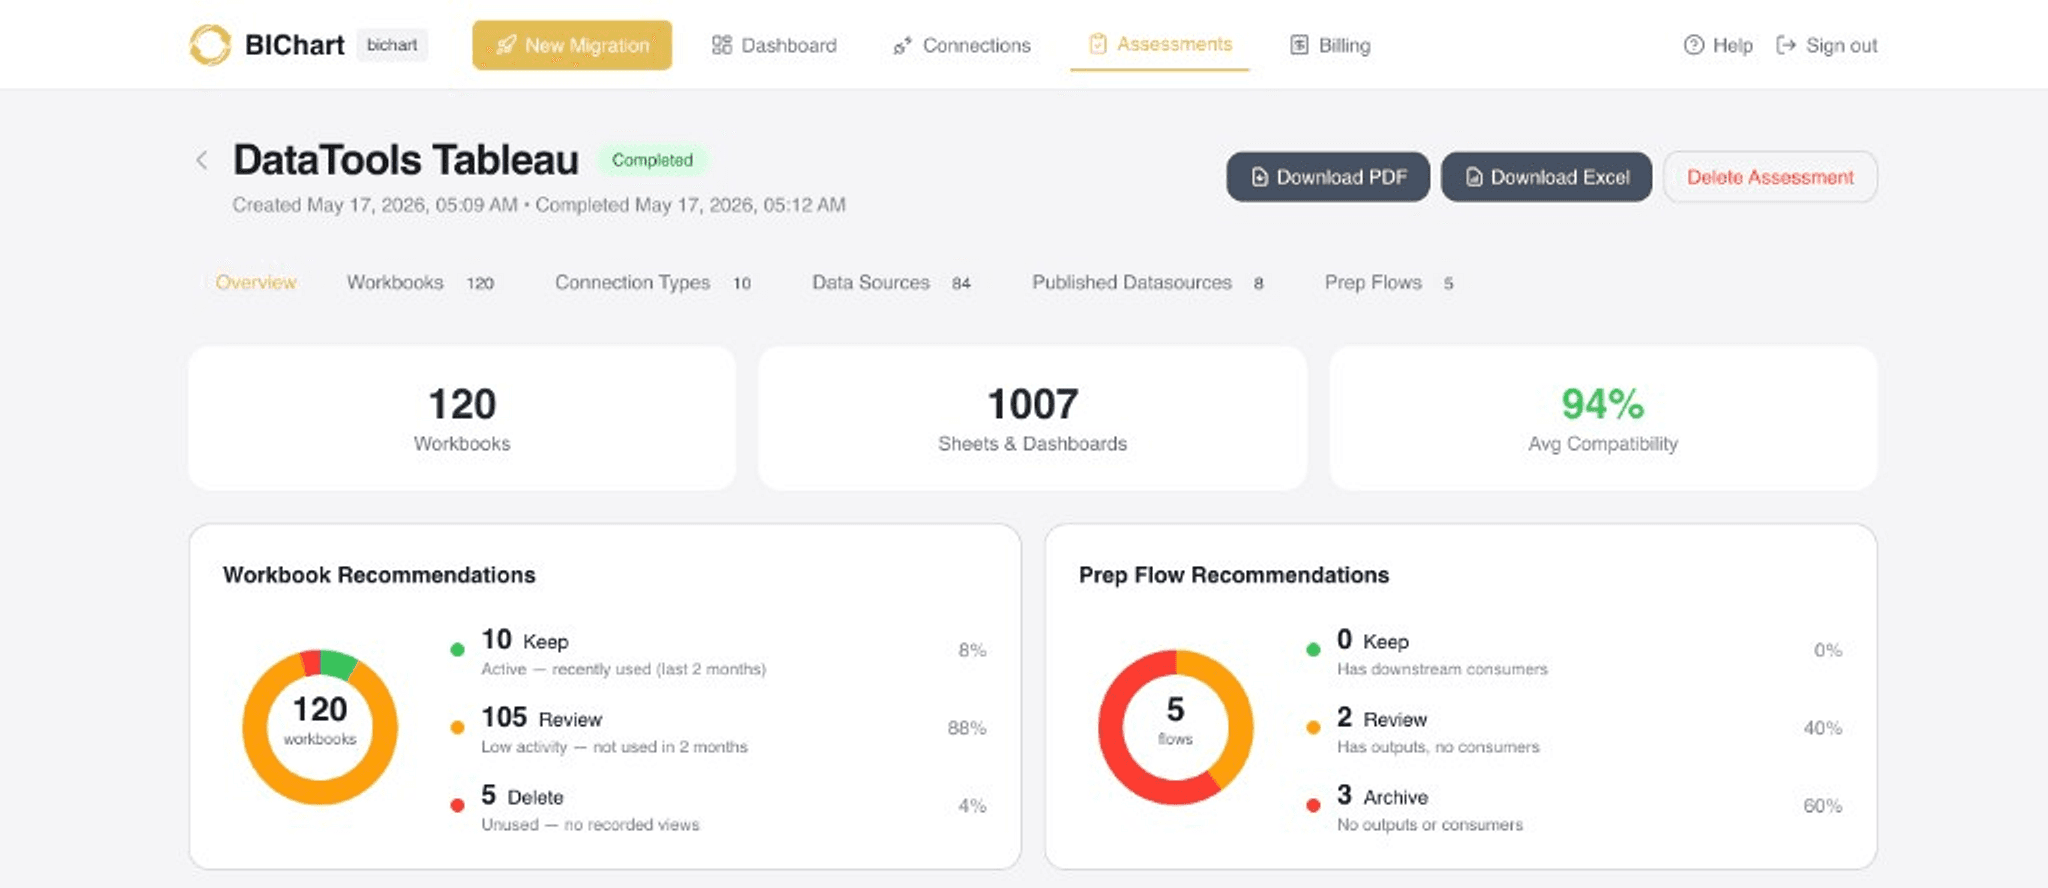
BIChart assessment overview with compatibility score and workbook recommendations

Analyze migration complexity, effort, and priority in one workspace.

Tableau Migration Assessment Tool For Enterprise Planning

BIChart maps complexity from Tableau metadata, usage patterns, and dependencies so teams can migrate high-value assets first and eliminate unnecessary work before execution starts.

Compatibility Score

0-100 score based on unsupported visuals, analytics features, and workbook complexity

Estimated Migration Time

Converts technical complexity into realistic effort for planning and staffing

Asset Classification

Keep, Review, and Delete recommendations reduce migration scope and cost

Dependency-Aware Planning

Workbooks, data sources, and shared models grouped for safe batch migration

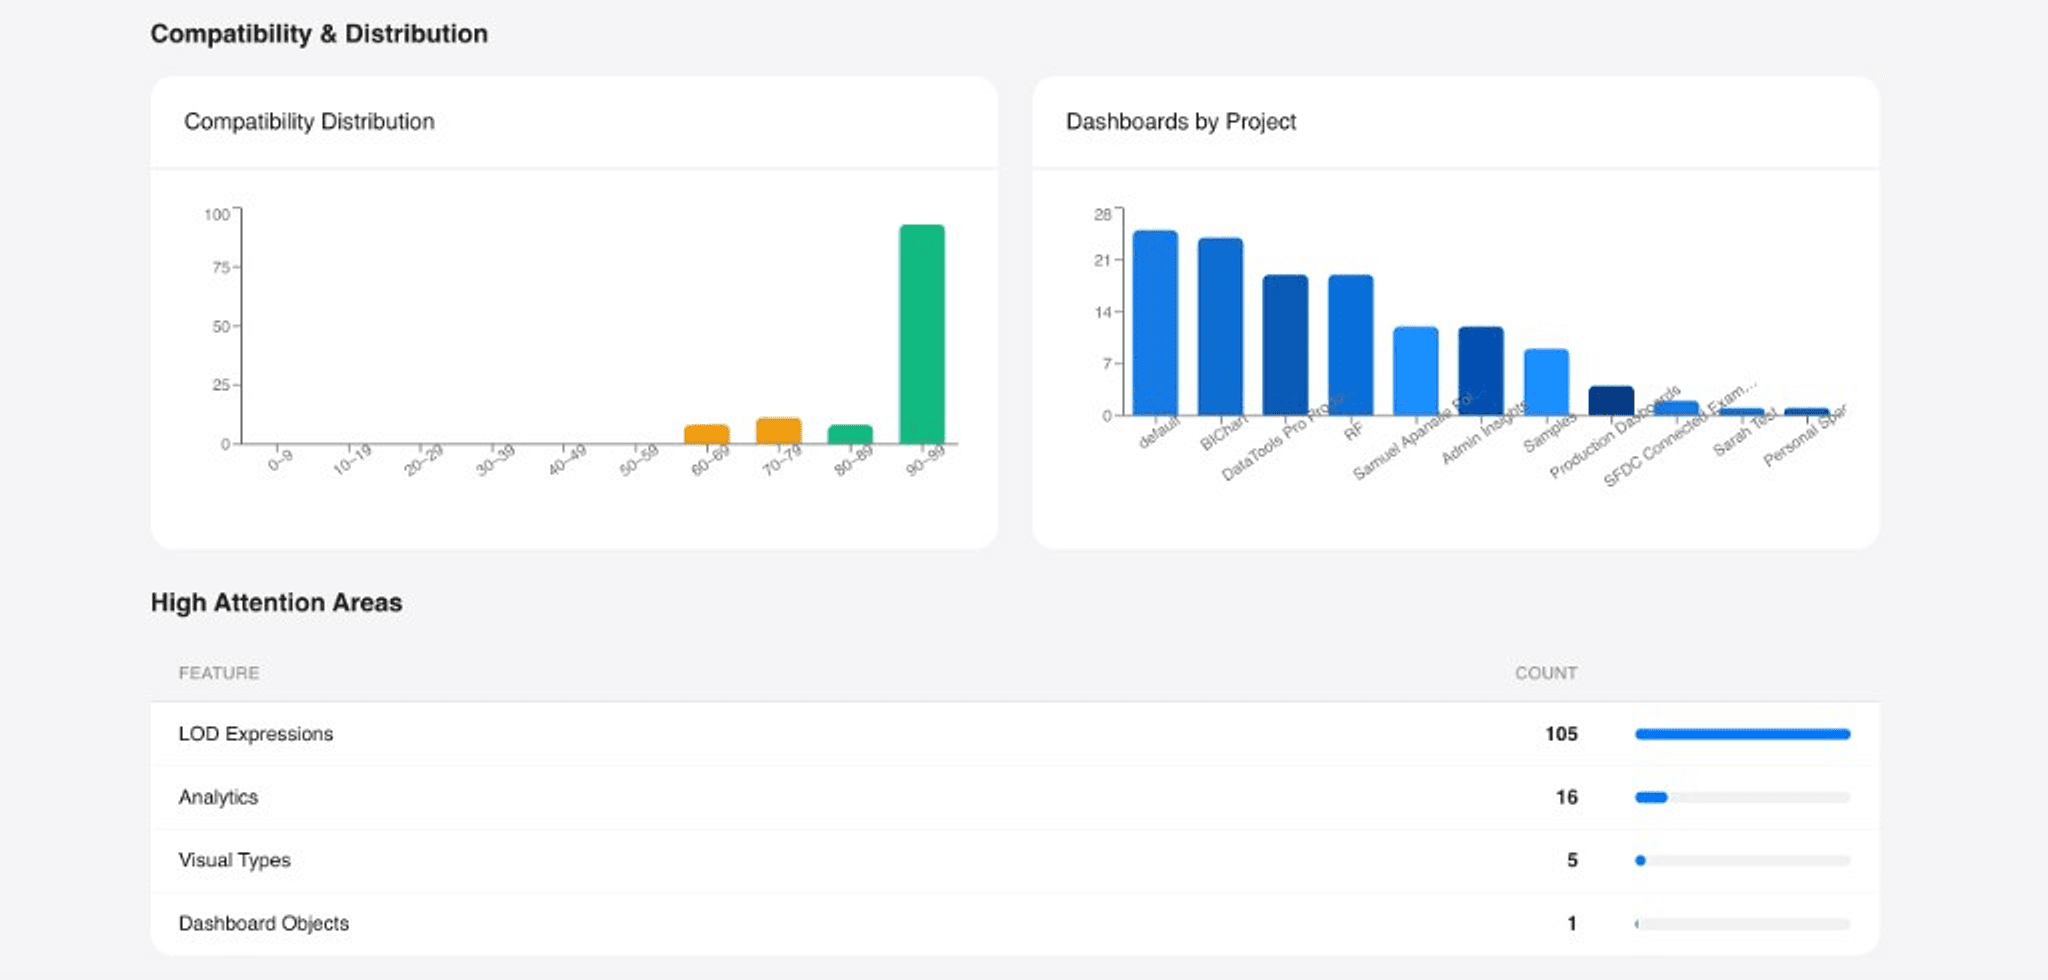
BIChart compatibility distribution and high attention areas

How BIChart Executes Migration Readiness

1

Connect Tableau Environment

Securely connect Tableau Server or Tableau Cloud and pull full asset inventory.

2

Model Complexity + Priority

BIChart analyzes XML features, LODs, dependencies, and usage to score compatibility and estimate effort.

3

Execute Migration Waves

Prioritize by value and risk, trigger bulk migrations, and export stakeholder-ready PDF/Excel outputs.

What the Migration Assessment Includes

BIChart's migration assessment tool turns Tableau metadata into a structured Tableau to Power BI migration approach — from dashboard inventory through complexity scoring to a recommended migration plan.

Tableau to Power BI Migration Approach

A successful migration follows a phased approach: assess the full Tableau estate, prioritize by business value and compatibility, sequence work into dependency-aware waves, then execute conversion with validated outputs. BIChart embeds that approach in product so teams skip spreadsheet-based planning.

  • Assess compatibility and usage across every workbook
  • Prioritize high-value, low-risk assets for early waves
  • Group dependent workbooks and data sources for safe batch migration
  • Export a wave plan stakeholders can approve before execution

Dashboard Inventory and Tableau Asset Scan

The assessment starts with an automated dashboard inventory of your Tableau Server or Tableau Cloud environment. BIChart catalogs every asset teams need visibility on before committing migration resources.

  • Workbooks, dashboards, and individual sheets
  • Data sources, extracts, and live connections
  • Calculated fields, parameters, and LOD expressions
  • Cross-workbook dependencies and usage patterns

Complexity Scoring and Compatibility Analysis

Each workbook receives a 0–100 compatibility score based on Tableau features that map cleanly to Power BI versus those requiring rework. Complexity scoring surfaces high-attention areas before migration sprints begin.

  • Unsupported or partially supported visuals and analytics features
  • Calculated field and LOD-to-DAX translation complexity
  • Workbook size, sheet count, and structural depth
  • Keep, review, and retire recommendations per asset

Tableau to Power BI Migration Cost Drivers

Migration cost depends on more than dashboard count. The assessment identifies cost drivers grounded in your actual metadata so budgets reflect real scope — not generic industry averages.

  • Number and complexity of workbooks and calculated fields
  • Data source types, blending, and authentication patterns
  • Manual rework for unsupported visuals and custom logic
  • Team composition, rates, and automation vs manual effort

Size hours and budget with our Tableau to Power BI cost calculator.

Recommended Migration Plan Output

Assessment outputs become the recommended migration plan your stakeholders review and approve. Teams get actionable sequencing, effort estimates, and export formats ready for program management.

  • Compatibility scores and keep / review / retire classifications
  • Migration wave sequence ordered by value, risk, and dependencies
  • Effort and timeline estimates per workbook and wave
  • Executive PDF summaries and Excel workbooks for cross-team tracking

Take Action: BIChart Resources to Plan and Execute

The assessment tells you what to migrate, what to retire, and in what order. These three resources turn those findings into a sized plan, a sequenced roadmap, and a business case your stakeholders will approve.

Size the initiative and put real numbers on cost

The assessment inventories your environment and scores complexity. The cost calculator turns that into hours, roles, and budget — replace "days per report times the number of reports" with an estimate grounded in your actual metadata.

Open the Tableau to Power BI cost calculator →

Plan your Tableau to Power BI and Fabric initiative with AI

The assessment scores every workbook and maps its dependencies. BIChart groups workbooks into migration waves by complexity, usage, and shared data sources so high-value, low-risk assets move first.

Rationalize and communicate the migration across your enterprise

The assessment produces a compatibility score, keep / review / retire recommendations, and PDF and Excel exports. Use them to show stakeholders what is worth moving and what the migration will take.

See a sample assessment report →

Trusted By Analytics Leaders Migrating At Scale

"BIChart assessed our Tableau environment for consolidation. We were blown away by how many data assets could be retired with low risk. The assessment was clearly presented and had clear and actionable recommendations."
Eric Kaufman

Fundcanna COO

Start Your BIChart Migration Assessment

Get compatibility scoring, effort estimates, and migration-wave recommendations in one product workflow.

We never store your data beyond the assessment process.

Frequently Asked Questions

What is a Tableau to Power BI migration assessment tool?

A migration assessment tool inventories your Tableau Server or Tableau Cloud environment, scores workbook compatibility for Power BI, estimates migration effort, and produces a recommended migration plan with wave sequencing and stakeholder-ready exports.

What is the best Tableau to Power BI migration approach?

Start with a full asset inventory and complexity scoring, prioritize high-value low-risk workbooks first, plan migration waves by dependencies and usage, then execute conversion with validated outputs. BIChart automates assessment and wave planning so teams avoid migrating everything at once.

How does BIChart inventory Tableau dashboards before migration?

BIChart connects to Tableau Server or Tableau Cloud and scans workbooks, sheets, data sources, calculated fields, parameters, and dependencies. Usage data and metadata feed dashboard inventory reports used for prioritization and effort estimates.

What drives Tableau to Power BI migration cost?

Migration cost is driven by dashboard count, calculated field and LOD complexity, data source types, dependency depth, manual rework for unsupported visuals, and team rates. Pair the assessment with the Tableau to Power BI cost calculator to translate inventory into hours, roles, and budget.

What Does BIChart Assess Before Migration?

BIChart inventories workbooks, sheets, data sources, usage, and dependencies, then scores compatibility and predicts migration effort.

How Does BIChart Decide What To Migrate First?

BIChart combines usage, compatibility score, workbook size, and dependencies so teams can run phased migration waves with lowest risk first.

What Output Formats Does BIChart Assessment Provide?

BIChart produces executive-ready PDF summaries and Excel outputs for assignment, wave planning, and cross-team execution tracking.

See It Live

Watch BIChart turn Tableau assessment into migration-ready intelligence.

Move From Assessment To Execution

Replace unclear migration planning with compatibility scoring, effort forecasting, and product-led execution.