
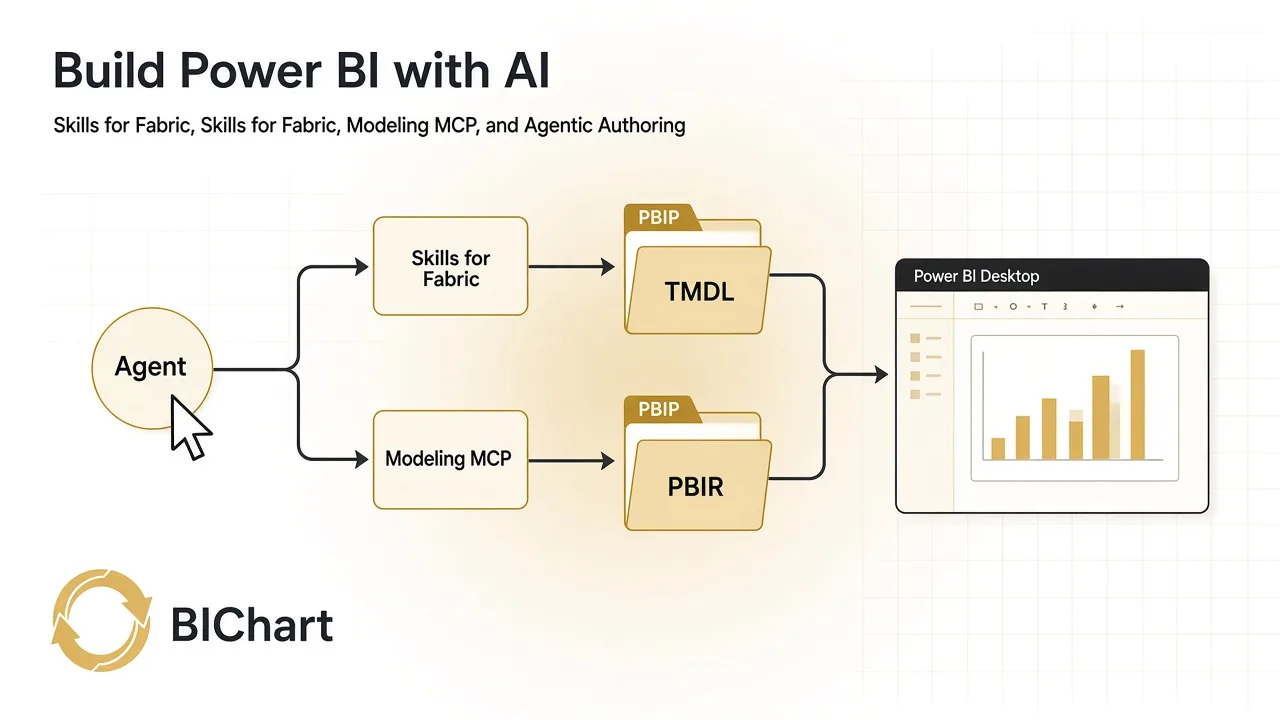
This Tableau to Power BI migration with AI approach takes one live workbook to a Power BI file you can open in Desktop. The tools are Microsoft’s: Skills for Fabric, the Power BI Modeling MCP, and PBIP/PBIR files edited by an AI coding agent.
Microsoft provides everything you need! You technically do not need a third-party migration toolkit, library or product. This article we created from our Power BI AI training, where we can land the same data in a Power BI project by pasting the prompts below, and opening a working dashboard result.
Start from the Tableau workbook
The example is a marketing workbook we start from is a Snowflake table called FRISCO_MKT_DATA. It’s built with Custom SQL. It has a parameter named Select Metric (click-through rate, conversions, or revenue influenced), KPI numbers, a channel bar, a trend line, and a campaign table. Write the same inventory for your own file before you prompt.

Results from translating Tableau to Power BI with AI
- Custom SQL on the warehouse table becomes a Power BI Import on that same table
- Select Metric parameter becomes a Metric Selector plus a Selected Metric measure
- KPI sheets become cards
- Best vs. Worst Performing Channels becomes a clustered bar
- Performance Over Time becomes a line chart on a Date table
- Campaign Performance Breakdown becomes a table
- Campaign and date filters become slicers
Tableau to Power BI migration power by AI
To migrate from Tableau to Power BI using AI we processed our Tableau wroking in this order. We let the agent do the model objects and the page conversion.
- In Tableau, note the connection, the SQL or table, the parameter, and the sheets you want on one page.
- On Windows, create a Power BI Project (.pbip) and import that same table. Save it in a local Git repo and open that folder in your favorite AI IDE like Cursor or Visual Studio (or another agent that can load skills and MCP).
- Install the
powerbi-authoringskills and register the local Modeling MCP. We covered this process in a recent article: AI tools for Microsoft Fabric - Paste the prompts below. Model prompts go through Modeling MCP. Page prompts go through the report authoring skill, which edits PBIR files on disk.
- Open the
.pbipin Power BI Desktop and refresh.
The .pbip file should list only the report under artifacts. The semantic model is picked up from definition.pbir.
Install Skills for Fabric
With GitHub Copilot CLI:
copilot plugin marketplace add microsoft/skills-for-fabriccopilot plugin install powerbi-authoring@fabric-collectionThat install includes semantic-model skills and power-bi-report-authoring. On Cursor, clone microsoft/skills-for-fabric or install the report skill with the APM CLI. Confirm skills with /skills in Copilot CLI.
Connect Power BI Modeling MCP
Modeling MCP creates measures, relationships, and other model objects. The report skill does not. Local MCP does not run on macOS, so do this on Windows. Microsoft also documents a hosted authoring MCP for Fabric workspace models.
npx -y @microsoft/powerbi-modeling-mcp@latest --startAccept the EULA, then prompt:
Open semantic model from PBIP folder '<your-project>/YourModel.SemanticModel/definition' or Connect to '<report name>' in Power BI Desktop
AI Prompts that rebuild the workbook
Swap table and column names if yours differ. Run them in order.
1. List the tables, columns, and measures in this model.

2. Create these measures on FRISCO_MKT_DATA with descriptions: Total Marketing Spend = SUM(FRISCO_MKT_DATA[MARKETING_SPEND]), Total Conversions = SUM(FRISCO_MKT_DATA[CONVERSIONS]), Total Clicks = SUM(FRISCO_MKT_DATA[CLICKS]), Total Impressions = SUM(FRISCO_MKT_DATA[IMPRESSIONS]), CTR = DIVIDE([Total Clicks], [Total Impressions]), Conversion Rate = DIVIDE([Total Conversions], [Total Clicks]), Total Revenue Influenced = SUM(FRISCO_MKT_DATA[REVENUE_INFLUENCED]), ROI = DIVIDE([Total Revenue Influenced] - [Total Marketing Spend], [Total Marketing Spend]).

3. Create a Date table related to FRISCO_MKT_DATA[CAMPAIGN_CREATED_DATE] and mark it as the date table.

4. Add a Select Metric field parameter with options CTR, Conversions, and Revenue Influenced, matching the Tableau parameter.

5. Using the Power BI report authoring skill, create a page named Marketing Overview with KPI cards for Total Marketing Spend, Total Conversions, CTR, Conversion Rate, and ROI. Add a clustered bar of CHANNEL by Selected Metric, a line chart of Date by Selected Metric, a campaign table, and slicers for campaign name and Select Metric.

6. Validate the report definition, then reload it in Power BI Desktop.
Refresh in Desktop so the Import model loads. You should land on Marketing Overview with the cards, channel bar, trend, campaign table, and both slicers.
Run the same path on your workbook
- Pick one Tableau workbook and list the table, parameter, and sheets.
- Create a PBIP on that data and open the folder in your agent.
- Install
powerbi-authoring@fabric-collection. - Register Modeling MCP on Windows.
- Ask for the measures, the date table, the metric selector, then the page.
- Validate, open the
.pbipin Desktop, and refresh.
Also on the blog: Build Power BI with AI: A Tableau to Power BI Migration Approach.
