
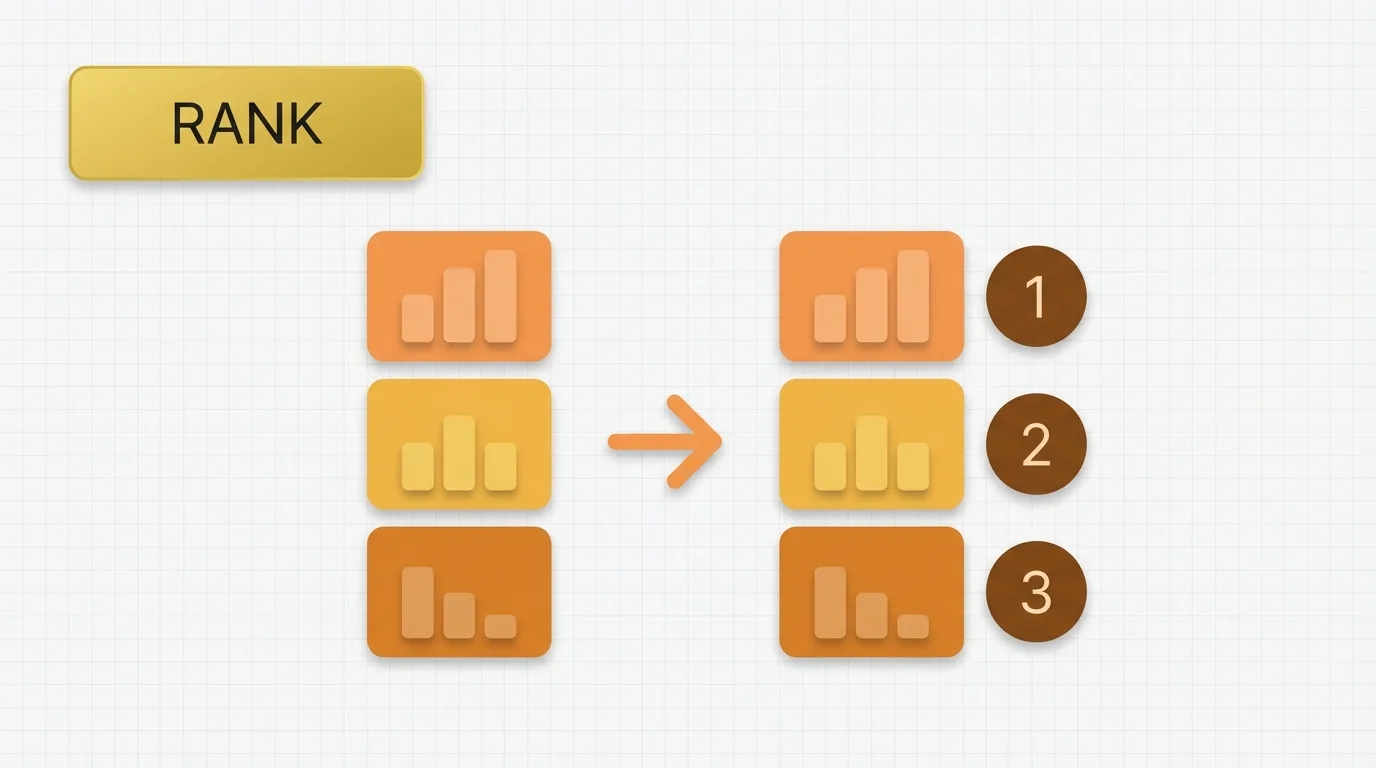

Problem Definition: Understanding Ranking in Power BI
Ranking addresses business questions such as:- Which product is selling the most in the current report?
- Which customer has the highest revenue in this region?
- Which store ranks first after applying a date filter?
- If the visual displays only product categories, the rank should compare those categories.
- If the visual is filtered to a specific region, the rank should typically reflect only the products in that region.
- If the report employs a measure with a complex filter context, the ranking may shift in ways that confuse users.
Key Concept: The Mechanics of Ranking
A rank calculation assigns an ordered position to each item within a set. The item with the highest value receives rank 1 when ranking in descending order, while the item with the lowest value receives rank 1 when ranking in ascending order. The essential factors influencing ranking are: 1. The value being compared. 2. The population being compared against. Changes in the population can lead to changes in rank. Understanding this behavior is crucial for analysts when deciding between `RANKX` and `RANK`.Data Example: Sales Table Analysis
Consider the following simple sales table:| Product | Region | Sales |
|---|---|---|
| Bike | East | 100 |
| Bike | West | 80 |
| Helmet | East | 60 |
| Helmet | West | 90 |
| Pump | East | 40 |
| Pump | West | 70 |
| Product | Total Sales |
|---|---|
| Bike | 180 |
| Helmet | 150 |
| Pump | 110 |
| Product | Total Sales | Rank |
|---|---|---|
| Bike | 180 | 1 |
| Helmet | 150 | 2 |
| Pump | 110 | 3 |
| Product | West Sales |
|---|---|
| Bike | 80 |
| Helmet | 90 |
| Pump | 70 |
| Product | West Sales | Rank |
|---|---|---|
| Helmet | 90 | 1 |
| Bike | 80 | 2 |
| Pump | 70 | 3 |
Tool Implementation: Understanding RANKX and RANK
What RANKX Does
In DAX, `RANKX` is the classic ranking function. It evaluates an expression over a table and returns the position of the current row within that table. The typical syntax is:RANKX(table, expression, [value], [order], [ties])
For example:
RANKX(ALL('Product'[Product]), [Total Sales], , DESC, DENSE)
This means:
- Rank each product.
- Use the `[Total Sales]` measure.
- Remove product filters with `ALL`.
- Sort in descending order.
- Use dense ranking for ties.
What RANK Does in Visual Calculations
In Power BI visual calculations, `RANK` is used to rank values that are already materialized in the visual. It is designed for the visual result rather than arbitrary model tables, making it useful when the ranking should follow the visual structure directly. Typical use:RANK([Total Sales])
The exact behavior depends on the visual calculation context and the visual-level data available at evaluation time. Use `RANK` when you want a rank based on the rendered visual output, and use `RANKX` when you need a broader DAX measure that can rank across a defined table or filter context.
Applied Example: Ranking Products by Total Sales
Suppose we want to rank products by total sales. A common DAX measure is:Product Rank = RANKX(ALL('Product'[Product]), [Total Sales], , DESC, DENSE)
With the earlier product totals, the result is:
| Product | Total Sales | Product Rank |
|---|---|---|
| Bike | 180 | 1 |
| Helmet | 150 | 2 |
| Pump | 110 | 3 |
| Product | West Sales | Product Rank |
|---|---|---|
| Helmet | 90 | 1 |
| Bike | 80 | 2 |
| Pump | 70 | 3 |
Why This Feature Exists: The Need for Ranking
Default aggregation is insufficient for ranking. A measure likeSUM(Sales) only returns a value without providing context on how that value compares to other rows. Ranking necessitates a comparison set, which is why `RANKX` exists in DAX. It allows you to define the table of competitors. Similarly, `RANK` exists in visual calculations to rank values after the visual has already determined the displayed set. Without these functions, Power BI would lack a standard method for ordering items by a measure and assigning position numbers.
Important Behavioral Details: Key Considerations
Filter Context Matters
Ranking is sensitive to filters. If a slicer removes products, the rank only applies to the remaining products unless the expression explicitly removes those filters.The Comparison Table Matters
With `RANKX`, the first argument defines the set being ranked. If that table is too narrow, the rank may only apply to a subset of the model. Conversely, if it is too broad, the rank may include items that users did not expect.Ties Need a Decision
Ranking logic must determine how to handle equal values. Dense ranking assigns the same rank to tied items without skipping numbers, while standard ranking may skip values after ties, depending on the function and parameters used. This distinction is crucial when users compare position numbers across reports.Visual Calculations Are Visual Scoped
`RANK` in visual calculations ranks what the visual has already returned. This differs from a model measure that can rank over a table unrelated to the visual layout. Understanding this distinction is essential for migration and troubleshooting.Blank and Zero Behavior Can Differ
If the measure returns blanks, the rank result may not behave like a simple numeric sort. It is advisable to test how blanks should be treated before using the result in a dashboard.Real Usage Patterns: Common Applications of Ranking
Common uses of ranking in Power BI include:- Top N product analysis
- Regional leaderboards
- Customer revenue ranking
- Store performance comparison
- Ranking within a selected period
- Percentile-style reporting patterns
- Sorted lists in matrix and table visuals
- Exception reporting by rank position
